TModeling
Start of topic | Skip to actions
Random notes on extending Chris' visualization tool
-- JackSnoeyink - 15 Mar 2006
x y z nx ny nz s t
where
to top
VisTRE
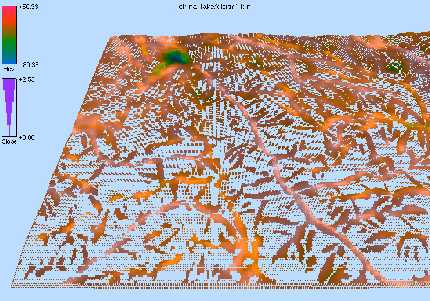
3DPVT submission describes the first prototype visualization tool in more detail. From my perspective, it would be ideal if we could turn this into a tool that NGA could use on its own data, because then we would know what tool was being used to evaluate our new surface representations based on meshless wavelets. * elevation and slope error:
Design ideas for second prototype
A system for the visual evaluation of surface representations.
The system will support error evaluation and display for a selection of ``surface modules,'' one of which is designated as ``ground truth''.Goals:
Use this to demonstrate that our new representations are as good as existing representations (and more compact) or better (and not larger). Show error combinations: elevation/slope, visibility/??Definitions:
- feature = visual properties: hue, luminance, size, orientation
- attribute = values from surface module: elevation, slope or error values derived from these.
- measurement locations = places to sample attributes of the surface
System consists of:
Error visualization module and Surface moduleCommunication beteween the modules:
EV module selects from a collection of surface modules, selects a base level-of-detail parameter, chooses a fine regular grid of measurement locations and obtains ground truth, sends desired measurement locations (possibly adapting to interest, view frustrum, ...) to surface module Surface module reports elevation (slope, ...) at queried points, EV module determines best visualization of results from several modules & ground truth.Error Visualization module needs
Toolset (maybe eventually a scripting language, if we can preserve interactivity) for combining attribute values from surface module(s) with ground truth to obtain error visualization. Select measurement locations adaptively:- choose points and density by view frustrum
- add/remove density by user preferences (an add-density brush or selection)
User interface...
Surface module needs
- on initialization with ground truth values, can optionally compute and apply registration corrections (translation, Euclidean, affine, perspective?)
- register exported attributes (and properties, such as ordinal/nominal, continuous/discrete, confidence)
- reports attributes at queried locations (maybe quadtree)
- return confidence for these attributes based on scale of queries?
- get/set base level of detail (with user interface widget) e.g. Surfaces may have elevation samples ordered by importance
Things to keep in mind, but not do in the next prototype:
- There are many alternatives for how EV module maintains its display lists and limits calls to surface modules. The prototype will choose some; we should record the alternatives.
- Different coordinate systems and geoids?
- We need to have a place for conversion to a canonical representation in the interface between the EV and surface modules.
- Scripting for error calculation/combination.
- hardcode these until we find out what are the things we might like to script, and can afford to do without harming interactive visualization.
- Implement lots of different LOD surface modules
Email from Jack to Ed on making an NGA-friendly prototype
We have a small prototype of a tool to compare terrain models that can show several error values simultaneously, thanks to Chris Healey, a specialist in perceptual visualization who is on sabbatical at UNC this year. I showed this tool briefly at our January meeting. The breakthrough on streaming means that we can now do a second prototype that handles realistic data set sizes. We believe that this tool would also be useful for NGA experts evaluating different terrain models, so we would also like NGA input on our design so that it, too, would fit into your workflow. (Of course, it can only help us if NGA is using our tools when they compare our representation of terrain to standard representations.)Email from Jack to Shawn on 2nd prototype ideas
the idea behind this system is to make a testbed for evaluating different surface representation modules using perceptual visualization, as well as numerical error evaluations. Chris Healey started with a first prototype that just takes two elevation sources on the same grid and displays them, employing the perceptual visualization ideas that Chris knows so well. Chris and I have talked about how to make a second prototype that is more flexible: by dividing into surface modules of several types and evaluation/visualization module and having the communication between the modules being that the eval/vis module queries the surface modules for elevations at chosen measurement locations. We would like to do this in a way that scales to large terrains, and can be viewed with culling based on viewer position and possibly interest, so that the view still gives an accurate impression of the errors at given locations. This, therefore, concerns the vis module interactions -- how does it choose measurement locations, and what does it do with the measurements that it gets there? Leo and Suddha are developing things that could turn into surface modules, once someone (like you), works out the interface for how to bring them into the program. And you may want to implement a couple of surface modules of your own to test, or if you have a favorite way to make elevation that you want to compare against theirs. So, my primary questions are on the engineering decisions for dealing with moderately large samples from very large data sets. How would you propose to maintain a set of measurements from measurement locations so that you could quickly show a relevant set on the screen? You can organize the sampled measurement locations in any way you wish. What would you want the interface with the surface module to look like, so that you can update the measurements when the surface module or its level of detail changes, while not doing too many more measurements than necessary? If you have a huge set of terrain data, how do you do these updates efficiently?State of first prototype
Email from Chris on prototype tool
1/19/2006 12:22 PM
Okay, the updated files and a slightly inproved cloud.exe are online on my web pickup page: http://www.csc.ncsu.edu/faculty/healey (the zip file is NED3-TMV.zip). I inverted and clipped all GRD files except for ned3.grd, which didn't seem to have any bad borders. One note: because there are still some high noise values for heights in some of the files (e.g., ned3-20k), the colour coding of height doesn't look great, because the high value is forcing most of the real errors into a very small relative range, and therefore a very simliar colour. Some additional clipping might fix some of this, but not all of it.1/19/2006 12:26 PM
The file format is very simple. It's a flat binary float file, each element has 8 float values:x y z nx ny nz s t
where
- x,y,z is position
- nx,ny,nz is normal direction (normalized to length=1)
- s is elevation error
- t is slope error (as angle)
to top
| I | Attachment  | Action | Size | Date | Who  | Comment |
|---|---|---|---|---|---|---|
| | srtm_hue_size.jpg | manage | 36.4 K | 16 Mar 2006 - 09:07 | JackSnoeyink | elevation and slope error |
Edit | Attach image or document | Printable version | Raw text | More topic actions
Revisions: | r1.2 | > | r1.1 | Total page history | Backlinks
Revisions: | r1.2 | > | r1.1 | Total page history | Backlinks